







How to turn your data into content with PostHog

Contents
Here's something we know (mostly) to be true about LLMs: they love novel, first-party data. They're hungry for it. I would be too if I was forced to rehash the same 100,0001 public datasets over and over again.
And it's not just the robots. People love it too. I always appreciate a company that takes the time to share real stats and benchmarks (shoutout Ahrefs, for example), and try to read as many as I can. I personally believe we're all a little better off for it.
So: robots love data. People love data. And PostHog just so happens to sit on a mountain of it.
Which is why I pitched us doing a study in my first quarter at PostHog.
And my second. And my third.
The reason why it never got picked up is because of how daunting of a task that used to seem. Somebody has to pull the data, sift through it, validate it, slice and dice it into something interesting, and then write an actual story around it.
We're busy people with spinning multiple plates around here, so the idea never got off the ground. Until now – fourth time was the charm!
Here's how, and why now.
Why we finally decided to write a data study
So what changed? Two things.
First, we got realistic. Instead of writing The Definitive PostHog Data Study Of All Things™, we scoped it down to a scrappier MVP.
My blue sky thinking went from "I want to do a study that will be cited in every QBR deck for the next five years" to "I want to write something I'm proud enough to show my mom2 and maybe share on my linkedin".
In all seriousness, we chose to focus on a proof of concept that would be interesting to our audience, and that we could actually ship in a reasonable amount of time.
Second, and this is probably where the biggest unlock is, the tools got good.
Like, really good.
PostHog AI started out questionable, but it really grew into itself in the last few months. It's a beast now. On top of that we shipped a great MCP, a Slack bot, improved our Notebooks, and generally made it easier to get at the data we already have.
In another life I used to spend days exporting datasets into spreadsheets and wrestling through assorted BI tools. All that manual grunt work that used to make writing something like this a massive pain in the ass, is now a few clicks and a couple of queries away.
Which means I get to spend most of my time doing the fun part: making creative and editorial calls.
What's the angle? What's the headline? Which graphs and visualizations would best tell this story?
That's what I signed up for when I decided to become a marketer, and now it's most of the job I've got.
How I actually wrote it
Here's roughly what we did, in order.
1. Brainstormed the angle with our MCP
I gave my agent a few guardrails to help me brainstorm: no PII, has to be data we already collect, and has to be something PostHog AI can pull relatively easily.
I also wanted to write about a tool I know well, so I seeded it with my favourites (Session Replay, Error Tracking, AI Observability, and the MCP itself) and let it argue back.
Prompt I used: You're helping me pick the angle for a data study (a short, very data-heavy blog post built entirely on PostHog's own first-party data). You have the PostHog MCP connected, so check event definitions and property definitions before you pitch me anything.
Hard guardrails:
- No PII, and nothing that identifies a specific customer, company, or user. Aggregates only.
- It has to be data we ALREADY collect. No "we should start tracking X."
- It has to be pullable in a handful of SQL queries.
- It has to be something PostHog would be comfortable publishing.
I want to write about a product I know well, so bias toward session replay, error tracking, AI observability, and the MCP itself, but don't limit yourself to those if there are other interesting alternatives. Give me 6 potential angles. For each one, add the specific events/properties you'd query to prove it, roughly how many charts it produces, and what they'd show. Then rank them: most interesting to a general tech audience, and easiest to actually pull. If those two rankings disagree, say so.
2. Pull the data with PostHog AI, straight into a notebook
Once I decided to focus on session replay and Replay Vision, I asked PostHog AI to pull the data I needed, and to create a Notebook to hold all my SQL queries and charts in one place I could go back and reference.
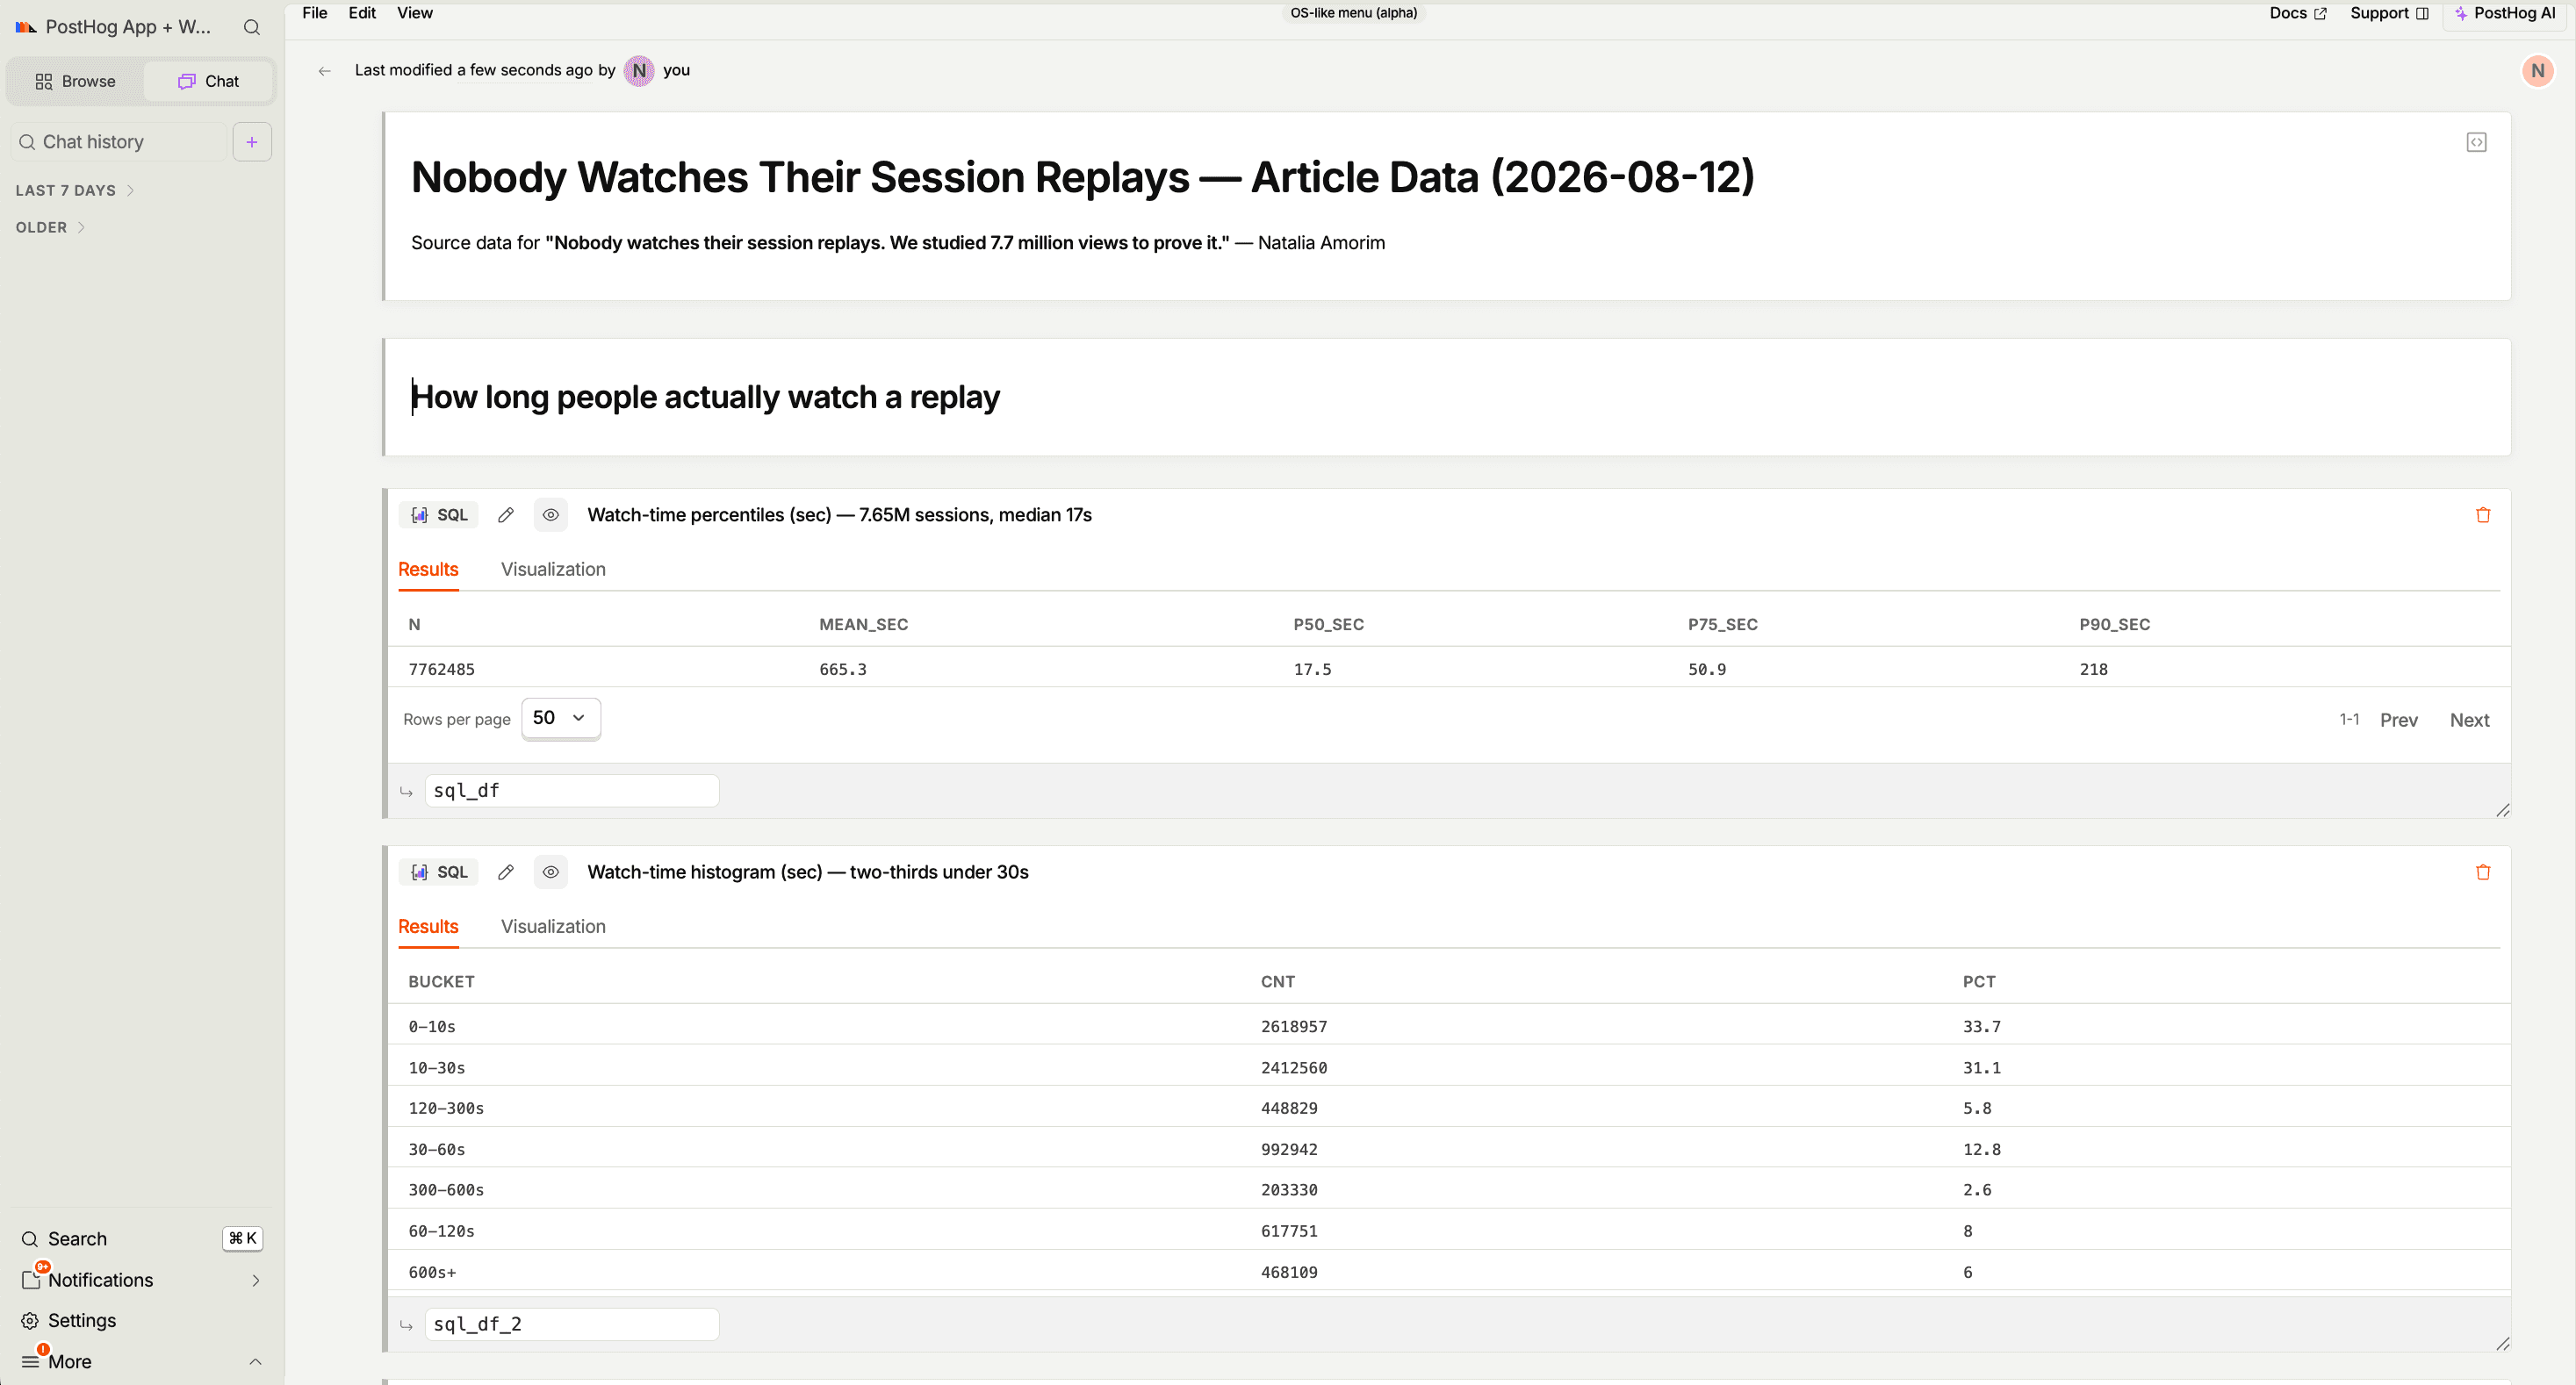
Prompt I used: Make me a notebook called "Replay data study" with every query and its SQL, so I can re-run them later. Cross-tenant, last 90 days.
- Every time someone opened the player and watched – how long? Median and full distribution.
- Median and mean length of the recordings themselves.
- Recordings captured vs. recordings opened at least once.
- Recordings captured per company. Median and mean separately.
- Distinct people who watched anything, and replays per watcher.
- Playback speed when people change it.
If a number can't be pulled, explain why and give me alternatives.
3. Interrogate the product with the PostHog Slack bot
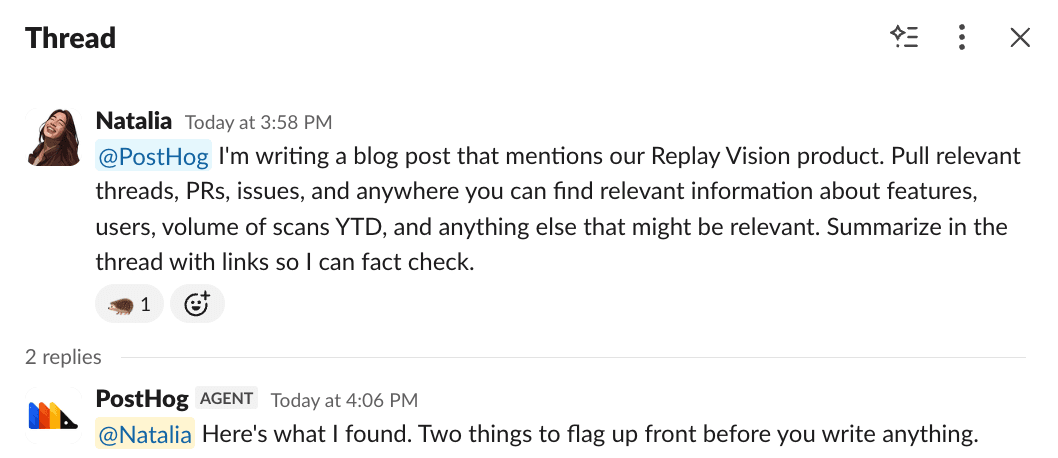
Since I'm not the person who built Replay Vision, I asked the Slack bot to gather all the context I needed to better understand it. It pulled in links to relevant docs, existing PRs, and it gave me a summary of the product and its features.
4. Write the first draft
The fun part. Self explanatory.
5. Mock up the graphs with Claude + the PostHog MCP
By now I had the raw numbers, but a table of medians doesn't exactly make a story. I wanted to see them and to play around with what different visualizations could look like, so I went back to the MCP and had Claude sketch a few versions of each.
It also turned into a second validation pass almost by accident: a wrong number tends to look wrong the second it's plotted, so anything that didn't reconcile got caught here.
Then I sent the whole thing to our Graphics team, who turned my Temu-grade doodles into something legit.
Prompt I used: Here are the SQL queries behind my study. Re-run each one through the PostHog MCP and check the numbers still hold – tell me about anything that doesn't match what I've got in the draft.
Then, for each query, show me three different ways to visualize the result. Different chart types, and a line on what each one gets across.
One self-contained HTML file I can scroll through as well as a separate ZIP folder with PNGs I can send to my graphics team.
6. Send it to review and ship it
You can read it here. Is it perfect? No, it's an MVP, and I can already see about 10 things I can do better next time.
But it exists, it shipped, and it's a glimpse of how much more of this we can do now.
That's kind of the point: this is the worst this process will ever be, and it was already good enough.
If that's the floor, I'm very excited about the ceiling.
Start to finish, this took a few days.
The version of me who learned VBA a few years ago after having a mental breakdown dealing with pivot tables (really showing my age here) would not believe it.
So if you've been sitting on your own mountain, wondering if a study is worth the lift: it may be less work than you think.


Install PostHog with one command
Paste this into your terminal and make AI do all the work.

PostHog is the leading platform for building self-driving products. With a full suite of developer tools – AI observability, product analytics, session replay, feature flags, experiments, error tracking, logs, and more – PostHog captures all the context agents need to diagnose problems, uncover opportunities, and ship fixes. A data warehouse and CDP tie it all together, unifying that context into one source agents can read across. You can steer it all from Slack, the web app, the desktop (PostHog Desktop), or your own editor via the MCP.